BNB Price Coiling for Breakout—Next Leg Higher in Sight
NewsBTC
2025-08-12 13:18:50


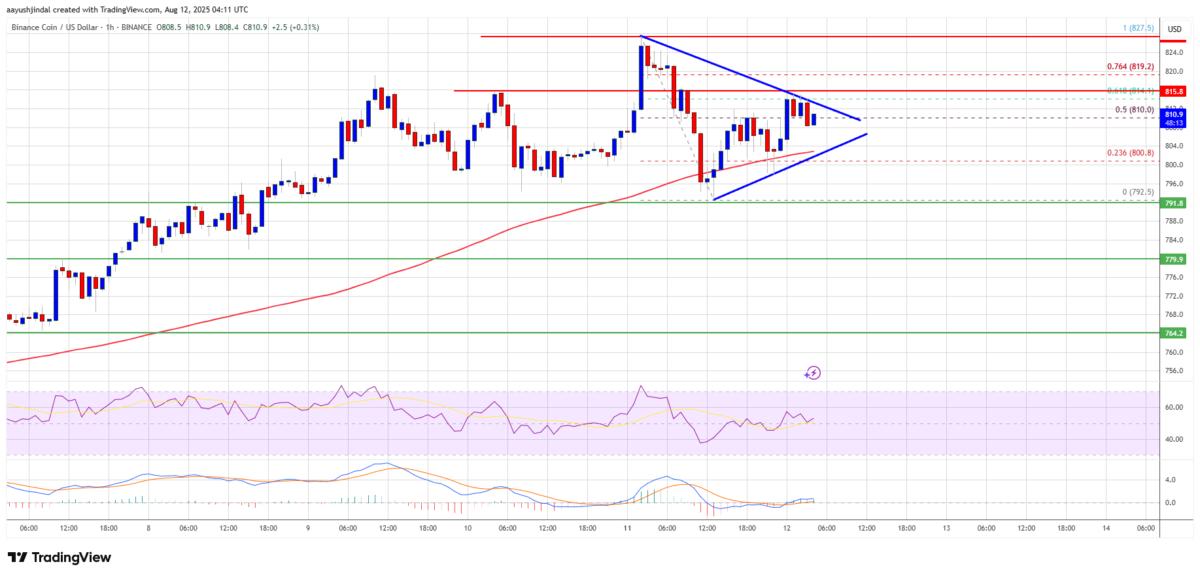
BNB price is correcting gains from the $825 zone. The price is now facing hurdles near $815 and might aim for a fresh surge in the near term.
- BNB price is correcting gains and traded below the $815 support zone.
- The price is now trading above $800 and the 100-hourly simple moving average.
- There is a key contracting triangle forming with support at $804 on the hourly chart of the BNB/USD pair (data source from Binance).
- The pair must stay above the $792 level to start another increase in the near term.
BNB Price Holds Support
After a steady increase, BNB price failed to clear the $830 zone. There was a downside correction below the $820 and $815 levels, like Ethereum and Bitcoin.
The price even dipped below $800 and tested $792. A low was formed at $792 and the price is now attempting a fresh increase. There was a move above the 50% Fib retracement level of the downward move from the $827 swing high to the $792 low.
The price is now trading above $810 and the 100-hourly simple moving average. There is also a key contracting triangle forming with support at $804 on the hourly chart of the BNB/USD pair.
On the upside, the price could face resistance near the $815 level or the 61.8% Fib retracement level of the downward move from the $827 swing high to the $792 low. The next resistance sits near the $820 level. A clear move above the $820 zone could send the price higher.
In the stated case, BNB price could test $832. A close above the $832 resistance might set the pace for a larger move toward the $840 resistance. Any more gains might call for a test of the $850 level in the near term.
Another Decline?
If BNB fails to clear the $815 resistance, it could start another decline. Initial support on the downside is near the $804 level. The next major support is near the $800 level.
The main support sits at $792. If there is a downside break below the $792 support, the price could drop toward the $780 support. Any more losses could initiate a larger decline toward the $768 level.
Technical Indicators
Hourly MACD – The MACD for BNB/USD is gaining pace in the bullish zone.
Hourly RSI (Relative Strength Index) – The RSI for BNB/USD is currently above the 50 level.
Major Support Levels – $804 and $792.
Major Resistance Levels – $815 and $820.
최신 뉴스
CoinNess
2025-08-21 01:41:52
CoinNess
2025-08-21 01:37:58
CoinNess
2025-08-21 00:44:33
CoinNess
2025-08-21 00:41:20
CoinNess
2025-08-21 00:37:15